-
Drag a new Case Table off the shelf. (See Figure 1)

Figure 1
Enter data from rectangle sheet using Number, Length and Width as attributes. (See Figure 2a)
-
Create a new attribute, Area by typing its name where you the <new> column heading. Then press enter or tab.
-
To create the formula for Area, highlight the column and choose Edit > Edit Formula. The formula editor appears; enter Length * Width and then press OK to close the editor. (See Figure 2b)

Figure 2a
|

Figure 2b
|
Drag a new graph off the shelf; drag the name of the attribute area to the horizontal axis. Change from Dot Plot to Histogram. (See Figure 3)

Figure 3
Choose Graph > Plot Value. The formula editor appears; enter mean ( ) and then press OK to close the editor. Repeat for median ( ). (See Figure 4)

Figure 4
Drag a summary table off the shelf. (See Figure 5a)

Figure 5a
Then drag Area to the cell below the down arrow. A value for mean will appear automatically. Note the summary table must be selected for the summary table to appear. (See Figure 5b)

Figure 5b
Choose Summary > Add Formula; enter in median ( ). (See Figure 6)

Figure 6
- Select the collection Rectangles (gold balls). Choose Analyze > Sample Cases. You will see the collection Sample of Rectangles appear.
Double click on Sample of Rectangles; the Inspector will appear. Deselect 'Animation' and 'With Replacement;' type in 5 for Cases. Click 'Sample More Cases.' (See Figure 7)

Figure 7
Drag a new Case Table off the shelf for Sample of Rectangles. This will show a random sample of 5 cases from the Rectangles collection. Note that if the sample collection is not selected, this will not work. (See Figure 8)

Figure 8
Drag a new graph off the shelf; create a histogram of area. (See Figure 9)

Figure 9
- Choose Graph > Plot Value; Enter mean ( ) and press OK to close the formula editor. The mean appears as a vertical line in the graph. Repeat for median ( ). (See Figure 10)

Figure 10
Double click on the Collection Sample of Rectangles to get the Inspector. Click on Measures; type in MeanArea. Click on the 'Formula' cell for the MeanArea and enter mean (area ). (See Figure 11)

Figure 11
Select the collection Sample of Rectangles; choose Analyze > Collect Measures. A new collection,Measures from Sample of Rectangles will appear.
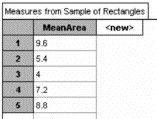
Drag a Case Table from the shelf for the collection Measures from a Sample of Rectangles. It will show 5 means, each of which is the result of selecting 5 random rectangles, which was done 5 different times. (See Figure 12a)
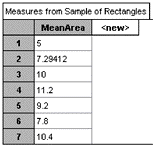
Double click on the collection Measures from Sample of Rectangles to get the Inspector. Deselect 'Animation' and enter '100' for measures; click 'Collect More Measures.' Your Case Table should now have 100 entries. (See Figure 12b)

|

|
|
Figure 12a
|
Figure 12b
|
Drag a new graph from the shelf; create a histogram of Mean Area. Use the Edit > Edit Formula; enter mean ( ). Repeat for median ( ). (See Figure 13)

Figure 13
Compare the graphs and their properties to the original data. Students should note any differences in spread, shape, mean, median, and mode.
There is a tendency for people to select a sample of rectangles with large area, thus causing bias. Was there evidence of this bias in your original sample? How do you know?
- Extension: Collect more measures (1000) and plot the Normal Curve on the Histogram. To accomplish this:
- With the graph selected, choose Graph > Scale > Density
- Choose Graph > Plot Function
- Enter normalDensity(x,mean( ),s( )).
